
ROIC: The One Number That Separates Compounders From Value Traps
On the only number that tells you whether growth is a blessing or a curse ... and why the two-times-earnings stock is often the one quietly burning your capital.

Key Takeaways
Return on invested capital (ROIC) is after-tax operating profit (NOPAT) divided by the capital actually tied up in operations; it is the most leverage-neutral measure of business quality.
ROIC only means something against the cost of capital: above WACC, growth creates value; below it, faster growth destroys value faster.
A compounder earns a high ROIC and can reinvest large amounts of new capital at that same high rate; Kardex held ROCE near 33% while growing capital employed +64% over 2019-2024.
A value trap earns a low ROIC, often below WACC, and looks cheap on purpose, Vodafone earned only ~2.5-3% on capital (negative in FY2025) against a ~5% cost of capital and cut its dividend in half.
Reported ROIC lies on serial acquirers: strip goodwill and acquired-intangible amortization out of Equasens and the operating return roughly triples, from ~11-15% to ~34%.
High returns fade toward the cost of capital; about 79% of excess return persists year to year on average, and a moat is what buys the slow fade.
Small-caps fade faster than large-caps on average, which is exactly why finding the durable, embedded small-cap exception in the attention desert is the edge.
The worked examples below each have their own deep dives, referenced throughout:
Let me put two stocks in front of you and watch your instincts betray you. The first trades at roughly two times earnings and pays an eleven percent dividend yield. Two times earnings. A yield that fat. Every value screen you have ever run, every dividend filter, every reflex Benjamin Graham bolted into your skull, is screaming at you to back up the truck. The second trades at something like thirty or forty times earnings and pays a yield so thin you need a microscope to find it. Expensive, obviously. Overpriced quality. The kind of thing you tell yourself you will buy on the next crash, which never comes. And in a great many real cases, you would be precisely, expensively wrong on both counts, because the cheap one is quietly setting fire to your capital while the dear one is compounding it at a rate that will make you wealthy if you simply sit still.
I know what you are thinking. How can a stock at two times earnings be the worse buy? That feels like a violation of natural law. So let us be good students and pull this apart, because the number that tells these two businesses apart, the single most important number in my entire process and the one my screen is built around, is return on invested capital. Get it right and you will understand why some cheap stocks deserve to be cheap forever, and why some expensive stocks are the bargains of the decade. Get it wrong and you will spend your investing life buying value traps and congratulating yourself on the low multiple right up until the dividend gets cut.
The Two-Minute Version (Read This Even If You Read Nothing Else)
Here is the whole argument in one breath. Return on invested capital measures how much profit a business generates for every unit of capital tied up in its operations, calculated as after-tax operating profit divided by invested capital. The number only means something when you compare it to the cost of that capital, because a business that earns more on its capital than the capital costs creates value as it grows, while a business that earns less than its capital costs destroys value as it grows. That single relationship, the spread between ROIC and the cost of capital, is the entire game, and it is why growth is a blessing for one company and a curse for another.
A compounder is a business that earns a high return on capital and can reinvest large amounts of new capital at that same high return, so its intrinsic value snowballs.
A value trap is a business that earns a low return on capital, often below its cost of capital, and looks statistically cheap precisely because the market correctly senses that its growth is value-destroying and its low multiple is deserved.
ROIC is also the quantitative fingerprint of a moat, because competition relentlessly drives returns down toward the cost of capital, and the only businesses that resist that gravity are the ones protected by something structural. That something, in my world, is supply chain embeddedness. This matters most in the European small-cap attention desert, because nobody is doing the work, so the market routinely misprices both the level and the durability of a small company’s returns on capital. My screen starts at a sustained ROIC above fifteen percent, comfortably above the seven to twelve percent that most businesses pay for capital, because that gap is where compounding lives.
That is the spine. The rest of this piece adds the meat, with a clean compounder and a textbook value trap from the real world, the canonical wisdom of Munger and the persistence research of Mauboussin, a comparison table you can actually use, and an honest tour of where ROIC lies to you. Casual readers, follow the main narrative and skip the clearly labeled deep dives. Serious readers, the weeds are where the edge lives, so wade in.
What Does ROIC Actually Measure? A 101 Course
Start with the definition, because most people who quote ROIC have never built it from scratch and it shows. Return on invested capital is net operating profit after tax, which we call NOPAT, divided by invested capital. NOPAT is simply operating profit (EBIT) with taxes taken out, EBIT multiplied by one minus the tax rate, and it represents the after-tax cash the operations throw off before any decision about how the business is financed. Invested capital is the money actually tied up in running the business, which you can build from the financing side as debt plus equity minus surplus cash, or from the operating side as net working capital plus net property, plant and equipment plus the intangibles the business genuinely needs. The two roads should arrive at roughly the same place. Divide the after-tax operating profit by that capital, express it as a percentage, and you have ROIC.
The reason I prefer ROIC to its more famous cousins is that it is honest about where returns come from. Return on equity, the number most investors reach for, can be inflated to the moon with debt, because piling on borrowings shrinks the equity base and flatters the ratio even when the underlying business is mediocre. A company can show a spectacular ROE and a pedestrian ROIC, and the gap between them is just leverage dressed up as quality. Return on assets has the opposite problem, dragging in idle cash and non-operating assets that have nothing to do with the operating engine. ROIC strips the financing decision out entirely and asks the only question that matters about the business itself: when this company puts a unit of capital to work in its actual operations, how many cents of profit does it get back? That is a leverage-neutral measure of operating quality, and it lets me compare a debt-light Swiss machinery firm with a debt-laden British telecoms giant on equal terms.
But here is the part that the textbook definitions bury, and it is the most important sentence in this entire course. The level of ROIC tells you almost nothing on its own. A ten percent ROIC is wonderful for a regulated utility and a disaster for an asset-light software company. What matters is the level relative to the cost of capital, the spread, and once you internalize that, everything else falls into place.
Deep Dive: How To Actually Calculate ROIC (And The Bits That Will Trip You Up)
For the serious reader, the devil lives in three adjustments, and getting them wrong will hand you a number that lies.
The first is what to do with cash. Operating cash that the business needs to run should stay in invested capital, but a large surplus pile sitting in money-market funds is not invested in the operations and should come out, otherwise you penalize a cash-rich company for hoarding and understate its true operating ROIC.
The second, and the most consequential, is goodwill and acquired intangibles. When a company buys another business, it records goodwill and writes up the acquired customer relationships and brands, and these sit in invested capital. Whether you include them changes what the ratio is telling you. ROIC including goodwill answers the question of whether the acquisitions created value, that is, whether management paid sensible prices, because it holds them accountable for the full purchase price. ROIC excluding goodwill answers a different question, the operating quality of the underlying business stripped of acquisition accounting. A serial acquirer can have a mediocre ROIC with goodwill (it overpaid) and a magnificent ROIC without goodwill (the businesses themselves are superb), and the difference between those two numbers is one of the most revealing things you can compute.
I will show you exactly this with a real name later.
The third trap is the denominator problem of old assets. A business with fully depreciated property, plant and equipment carries those assets at almost nothing on the balance sheet, which shrinks invested capital and inflates ROIC, making a tired old industrial look more capital-efficient than it really is. Operating leases, now mostly capitalized under current accounting, used to hide capital off the balance sheet entirely and still need care. None of this is busywork. Each adjustment changes the verdict, which is why ROIC is a judgment rather than a number you download.
Why Does The Spread, Not The Level, Create Value?
Now to the heart of the matter, the relationship that makes ROIC the master metric. A company funds itself with a mix of debt and equity, and that funding has a cost, the weighted average cost of capital, or WACC, which for most businesses lands somewhere between seven and twelve percent. When a company earns a return on its invested capital that exceeds this cost, every unit it deploys produces more value than it consumed, and so growth makes the business more valuable. When a company earns less on its capital than the capital costs, the logic flips with brutal symmetry: every unit it deploys destroys a little value, and so growth, the very thing investors usually cheer, actively makes shareholders poorer. This is the framework McKinsey’s valuation work (the Koller, Goedhart and Wessels canon) has hammered for decades, and it is captured in a single chart that every investor should tattoo somewhere visible: growth only creates value when ROIC is above the cost of capital, and below it, faster growth simply destroys value faster.
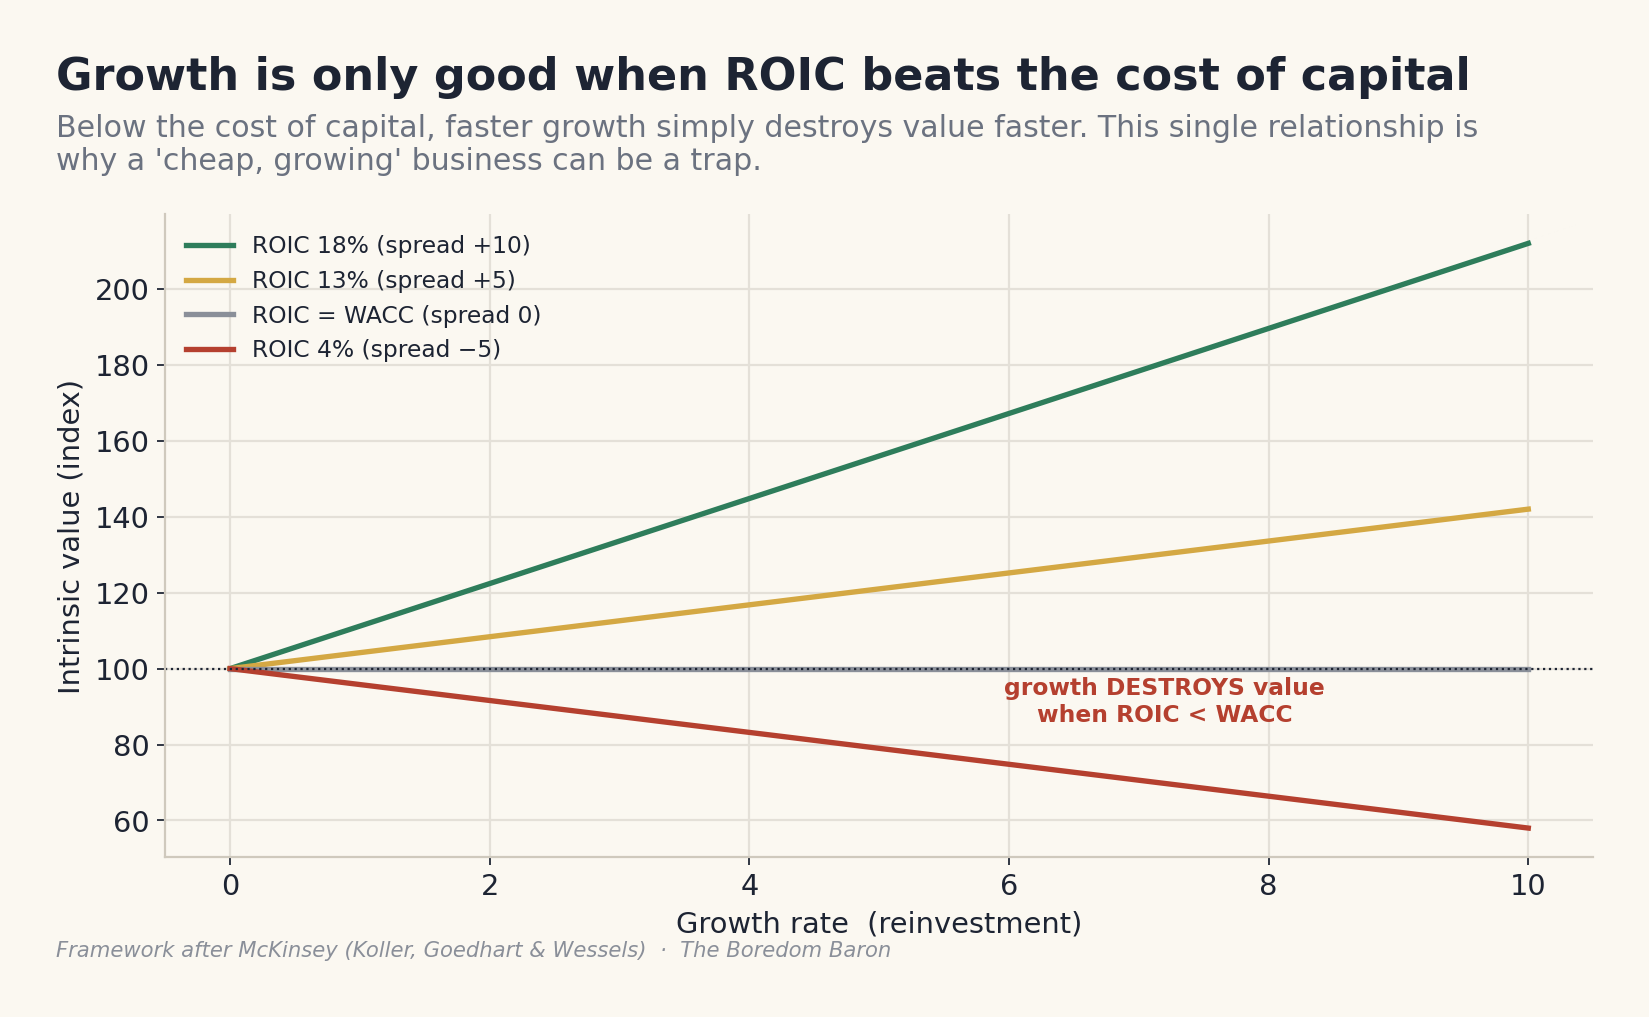
Sit with the implication, because it is genuinely counterintuitive and it is the whole reason value traps exist.
A business earning four percent on capital against a six percent cost of capital is a machine for converting shareholder wealth into corporate activity. It can grow revenue, win awards, employ thousands, and dominate headlines, and it will still leave its owners worse off every year it expands, because it is reinvesting their money at a loss relative to what that money costs. The market is not stupid about this. It prices such a business cheap on purpose, with a low multiple and a high dividend yield, because the cheapness is the market’s verdict that the growth ahead is value-destroying. The low multiple is not an opportunity. It is a warning label. And the investor who buys it because it looks cheap has mistaken the warning label for a discount tag.
This is also where I part company, gently, with the deepest of deep-value purists. Graham’s net-net world was a world of liquidation, of buying a dollar of assets for fifty cents and waiting for the gap to close. It worked, and in pockets it still does. But for a going concern that intends to keep operating, keep reinvesting, keep growing, the asset discount is a trap if the engine inside earns less than its capital costs, because every year the business keeps running it grinds a little of that discount away. Time is the friend of the wonderful business and the enemy of the mediocre one. ROIC versus WACC is simply the instrument that tells you which one you are holding.
The Compounder: High ROIC With A Reinvestment Runway
Flip to the other end. The most beautiful object in all of investing is a business that earns a high return on capital and has a long runway to reinvest fresh capital at that same high return, because such a business compounds its intrinsic value at extraordinary rates with almost no help from the investor. Charlie Munger put the whole philosophy into one passage in his 1994 talk on worldly wisdom, and I think about it constantly. His point was that over a long holding period, your return as a shareholder converges on the return the business earns on its capital, almost regardless of the price you paid. A business that earns six percent on capital for forty years will hand you something close to a six percent return even if you bought it at a deep discount, because the mediocre internal compounding eventually swamps your clever entry price. And the mirror, the part that converts value investors into quality investors, is that a business earning eighteen percent on capital for two or three decades will make you rich “even if you pay an expensive looking price,” to use Munger’s exact phrase, because the magnificent internal compounding eventually swamps your overpayment.
This is why I am willing to pay up for genuine quality, and why a low multiple has never once tempted me on its own. But Munger’s insight comes with a crucial condition that the quality-at-any-price crowd often forgets, which is the reinvestment runway. A high ROIC compounds your wealth only to the extent the business can plow earnings back in at that high rate. Warren Buffett drew the distinction perfectly when he described two businesses that both earn twelve percent: one lets you take the cash out every year, while the other must reinvest all of its cash just to stand still, so you never see a penny. The first is a fine investment and the second is a treadmill, and the difference is entirely about whether high returns come with somewhere profitable to redeploy capital. The arithmetic is simple and worth carrying in your head: a company’s intrinsic value compounds at roughly its ROIC multiplied by the fraction of earnings it reinvests. A business earning thirty percent on capital that reinvests all of it compounds intrinsic value at close to thirty percent, while an equally excellent business earning thirty percent that can only redeploy a tenth of its earnings, returning the rest as dividends, compounds the core at a far gentler pace and hands you cash you must find a home for yourself. Both can be wonderful. Only the first is a compounding machine.
Worked Example One: Kardex, A Compounding Machine You Can Actually Watch Work
Let me show you the ideal pattern in a real company from my universe, and I have chosen one where the data is almost a textbook illustration. Kardex Holding (SIX: KARN), the Swiss intralogistics group, makes automated storage and retrieval systems, the vertical lift modules and carousels and AutoStore installations that warehouses use to fetch parts efficiently, and it wraps that hardware in a growing, high-margin lifecycle service business. Crucially, it is capital-light: it runs only a handful of manufacturing facilities and assembles premium systems largely to order, so it does not need to sink enormous capital into plant to grow. And one housekeeping note before the numbers, because precision is the whole point of this article: Kardex reports in Swiss francs, not euros. Every figure below is in CHF.
Now look at the returns, drawn from the company’s FY2024 accounts, which you should of course verify against the annual report. For the year to December 2024, Kardex generated operating profit (EBIT) of CHF 103.8 million on capital employed of roughly CHF 316.4 million, total assets of about CHF 493.5 million less current liabilities of about CHF 177.1 million, which is a return on capital employed of around 32.8 percent. That figure is pre-tax, so the after-tax ROIC, applying a Swiss tax rate of roughly 22 percent, lands closer to 24 or 25 percent, but either way it sits at three or four times a typical cost of capital and roughly double the machinery industry average of around 15 percent. And here is the magic, the second half of the compounding equation. Over the five years to 2024, Kardex held that return on capital high while the capital employed in the business grew from CHF 192.6 million in 2019 to CHF 316.4 million in 2024, a rise of about 64 percent. Read that again. It did not earn high returns on a static pile of capital, which would make it a cash cow with no runway. It earned high returns while continuously deploying much more capital at those same high returns. That is Buffett’s ideal business made flesh: high ROIC and a long reinvestment runway, the rarest and most valuable combination there is.
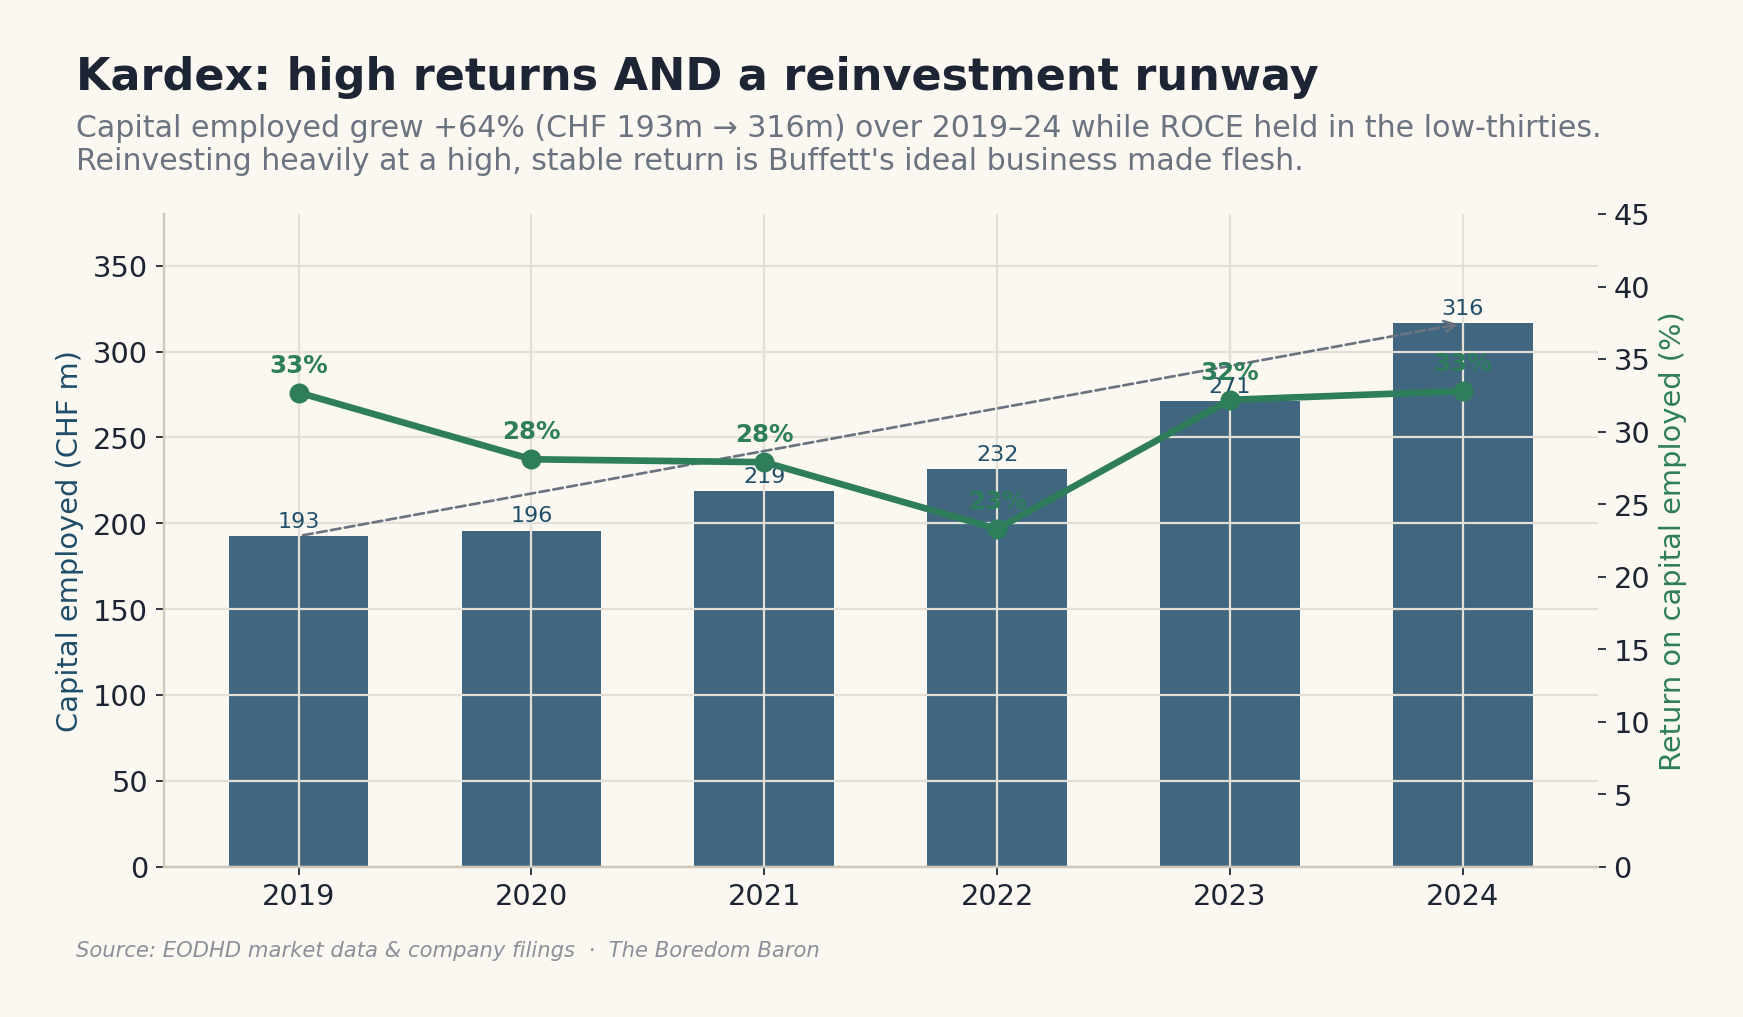
I want to be honest about the shape of that curve rather than flatter it, because honesty is the brand. The return on capital did not march in a dead-flat line; it dipped to 23.3 percent in 2022 in a mid-cycle wobble before recovering. Trace the whole series and you get a business that held its returns in the high-twenties to low-thirties throughout (32.7 percent in 2019, 28.1 percent in 2020, 27.9 percent in 2021, 23.3 percent in 2022, 32.2 percent in 2023, and 32.8 percent in 2024) ending the period essentially where it began, near 33 percent, with one cyclical breath in the middle. That is not a fluke, and it is not a straight line either. It is a durable franchise absorbing a soft patch and reasserting itself, which is precisely the texture you want to see, because a return that never wobbles is often a return that has not yet been tested. Over the same window revenue grew from CHF 471.2 million to CHF 791.2 million, so the high returns were earned on a business that nearly doubled in size.
What does such a business cost? A premium multiple, naturally, because the market is not blind. As of June 2026 Kardex trades around CHF 231 a share, within a 52-week range of roughly CHF 202 to CHF 340, for a market capitalization near CHF 1.75 billion and a price-to-earnings multiple of about 46. Forty-six times earnings. Read that next to the two-times-earnings stock from the opening and feel your Graham reflex twitch. This is exactly where investors who anchor on the multiple go wrong, and exactly where Munger’s wisdom earns its keep. If Kardex can keep reinvesting in the high twenties for another decade, the entry multiple will prove almost irrelevant to your long-term return, swamped by the internal compounding, and the investor who refused to pay up because it looked expensive on a screen will have missed the compounding to save a few points on the purchase price. Whether the reinvestment runway truly persists is the real question to interrogate, which is what the embeddedness and persistence work is for, but the shape of the business is the shape of a compounder, and no value screen would ever have put it in front of you.
The Value Trap: Low ROIC With A Tempting Price
Now the cautionary mirror, and I want a real, recognizable name rather than a tactful composite, because the lesson only lands when it has teeth. Consider Vodafone (LSE: VOD), the European telecommunications giant, which for the better part of a decade was the value trap par excellence, the stock that looked irresistibly cheap on every conventional metric while quietly destroying the capital of everyone who fell for it.
The numbers tell the story with painful clarity. Telecommunications is among the most capital-hungry industries in Europe, forever pouring money into spectrum and network upgrades, and Vodafone’s returns never came close to justifying that capital intensity. By the company’s own admission in its 2023 full-year results, its return on capital employed had sat below its weighted average cost of capital for over a decade, with management bluntly conceding “our performance has not been good enough.” Rebuild the ratio from Vodafone’s own EODHD-reported accounts and the admission is borne out in cold arithmetic. Take operating profit, tax it at a normalized rate, and divide by invested capital of well over GBP 100 billion, and the return on invested capital comes out at only about 2.5 to 3.5 percent across the last several years … and it actually turned negative, around minus a third of a percent, in the year to March 2025, when operating profit briefly slipped into the red. Now set that against the cost of the capital, estimated from those same EODHD inputs rather than borrowed from anyone else: a cost of debt of roughly 4.5 percent (interest expense over total borrowings) and a CAPM cost of equity near 6 percent (on a reported beta of about 0.32), which blend to a weighted average cost of capital in the region of 5 percent. The verdict is unavoidable. The company has been earning perhaps two to three points less on its capital than that capital costs, year after year, which is the precise financial signature of a business that destroys value as it grows.
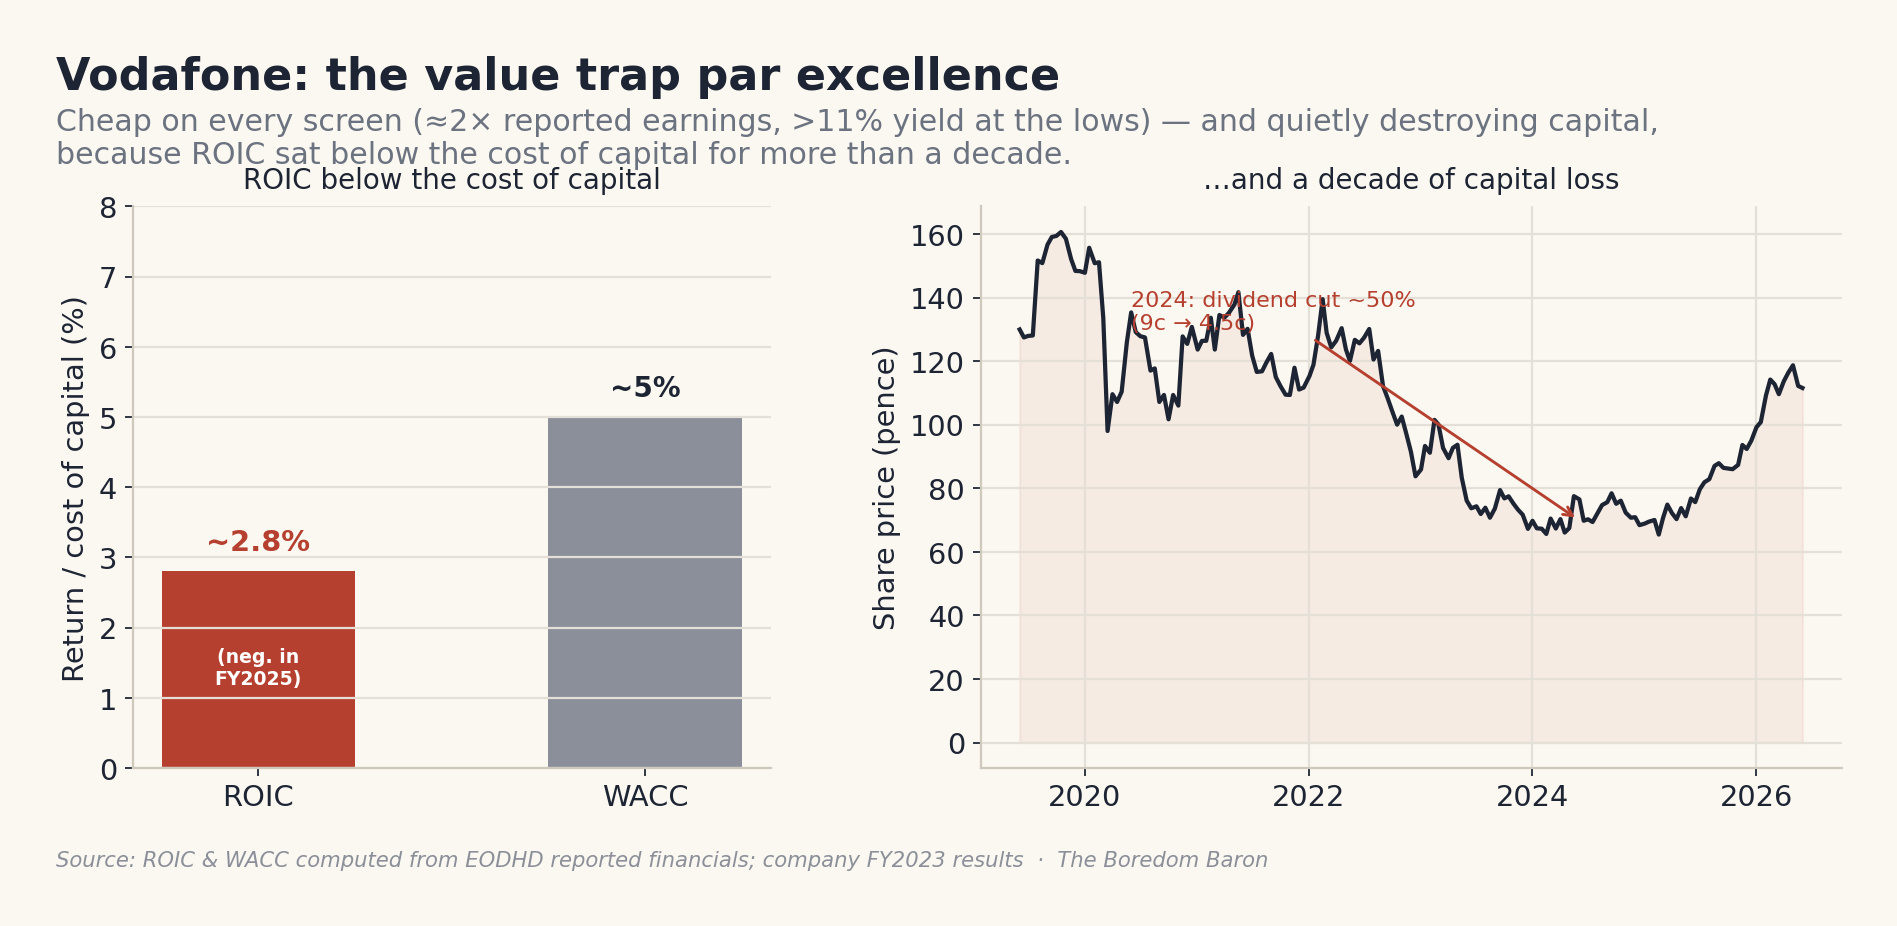
Now recall how cheap it looked through that decade. At one point in 2024 the shares changed hands at around two times reported earnings (a figure distorted by one-off asset-sale gains, with the adjusted multiple closer to eight) and offered a dividend yield north of eleven percent. Every screen on earth flagged it as deep value. And the ending was the one ROIC predicts: in 2024 the company cut its dividend in half, from nine cents to four and a half, and the share price spent years grinding lower, so that the fat yield was repeatedly an illusion erased by capital losses. One commentator looked at the two-times multiple and the double-digit yield and wrote, correctly, “beware the value trap.”
The capital destruction is not a matter of opinion, it is in the accounts. Run the numbers and the franchise has bled red ink in size: net income of roughly negative GBP 4.17 billion in FY2025 and negative GBP 0.39 billion in FY2026, with a trailing return on equity of about 0.11 percent … a rounding error away from zero. And the dividend, the very thing that lured the yield-hunters, has been quietly drained: dividends paid fell from about GBP 2.43 billion to GBP 1.79 billion to GBP 1.08 billion across the most recent years. The eleven-percent yield was never income. It was the market’s estimate of how much of your capital you were about to lose, paid back to you in installments out of the wreckage.
What makes Vodafone the perfect teaching case is that the cure proves the diagnosis. The company’s own remedy, under pressure, was to shrink out of its worst markets, and Morningstar notes that Vodafone divested its Spanish and Italian operations in 2024 precisely because of their low returns on invested capital. That is the ROIC discipline of this very article playing out in the boardroom: management finally accepted that growth and presence in low-return markets were destroying value, and the value-creating move was to exit them. The subsequent partial recovery of the shares into 2025 and 2026, helped by the UK merger and a German stabilization, came not from the cheapness that lured value investors years earlier but from the company belatedly attacking its return-on-capital problem. By June 2026 the stock trades around 111.85 pence, within a 52-week range of roughly 67.55 to 131.1 pence, with a market capitalization near GBP 25.8 billion and a post-cut dividend yield of about 4.17 percent, a far cry from the eleven percent that lured the unwary, and tellingly, the yield came down because the dividend came down, not because the price ran away. The cheap multiple was never the opportunity. The low ROIC was the truth, and the cheap multiple was simply the market pricing that truth correctly. An investor armed with nothing but ROIC versus WACC would have avoided a decade of pain that a P/E screen actively walked them into.
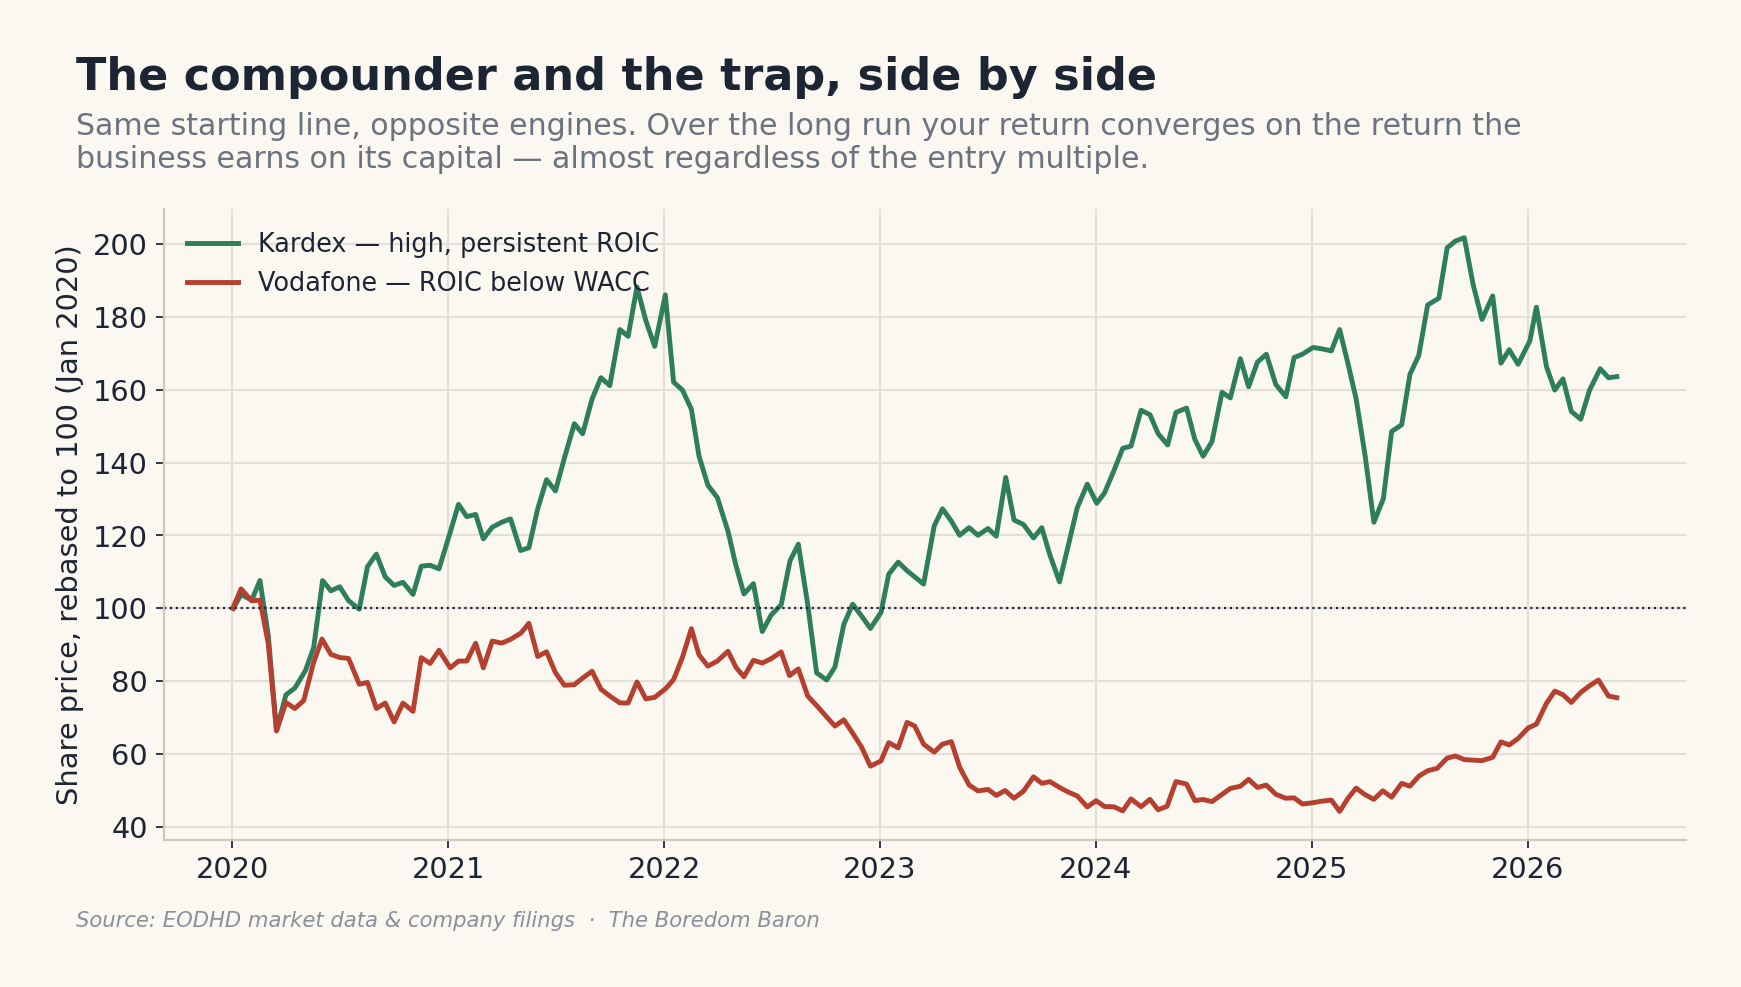
The Compounder And The Trap, Side By Side
Answer engines, and tired humans, both love a clean table, so here is the entire argument compressed into one. These two businesses are not subtle variations on a theme; they are opposite physics. Note in particular the column that matters most, the spread between ROIC and the cost of capital, and how it predicts everything downstream of it, the multiple included.
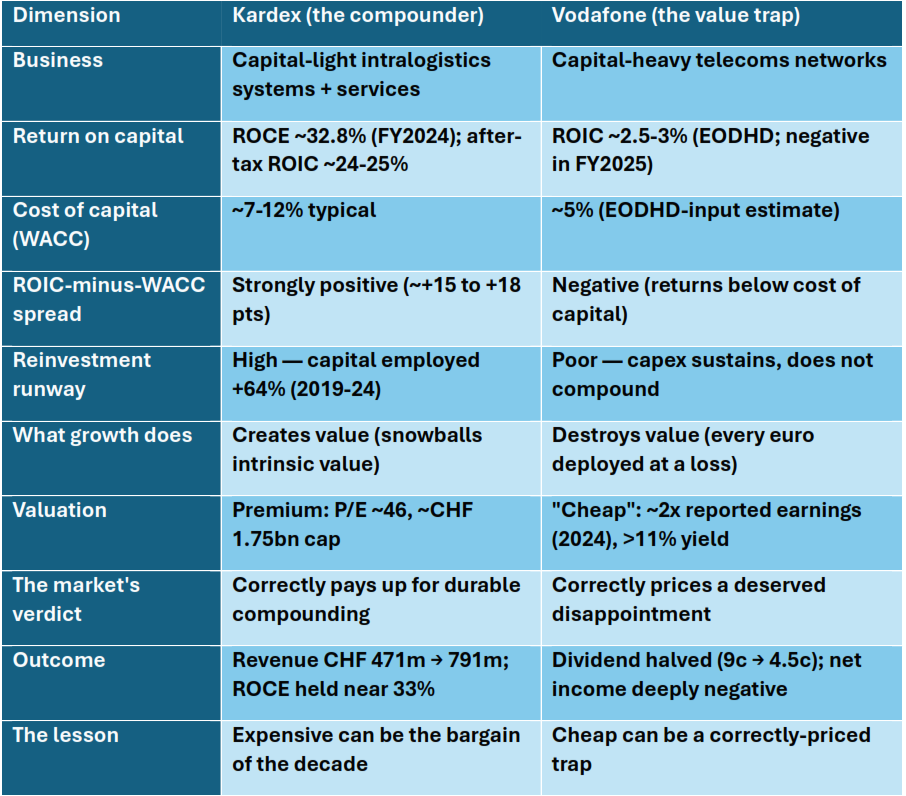
Stare at that for a moment, because rebased to a common starting point the two share-price paths tell the same story the table does, one curve climbing as the internal compounding does its quiet work, the other grinding lower as the negative spread bleeds the franchise. Over a long enough horizon your return as a shareholder converges on the return the business earns on its capital, and the chart below is simply Munger’s sentence drawn as a picture.
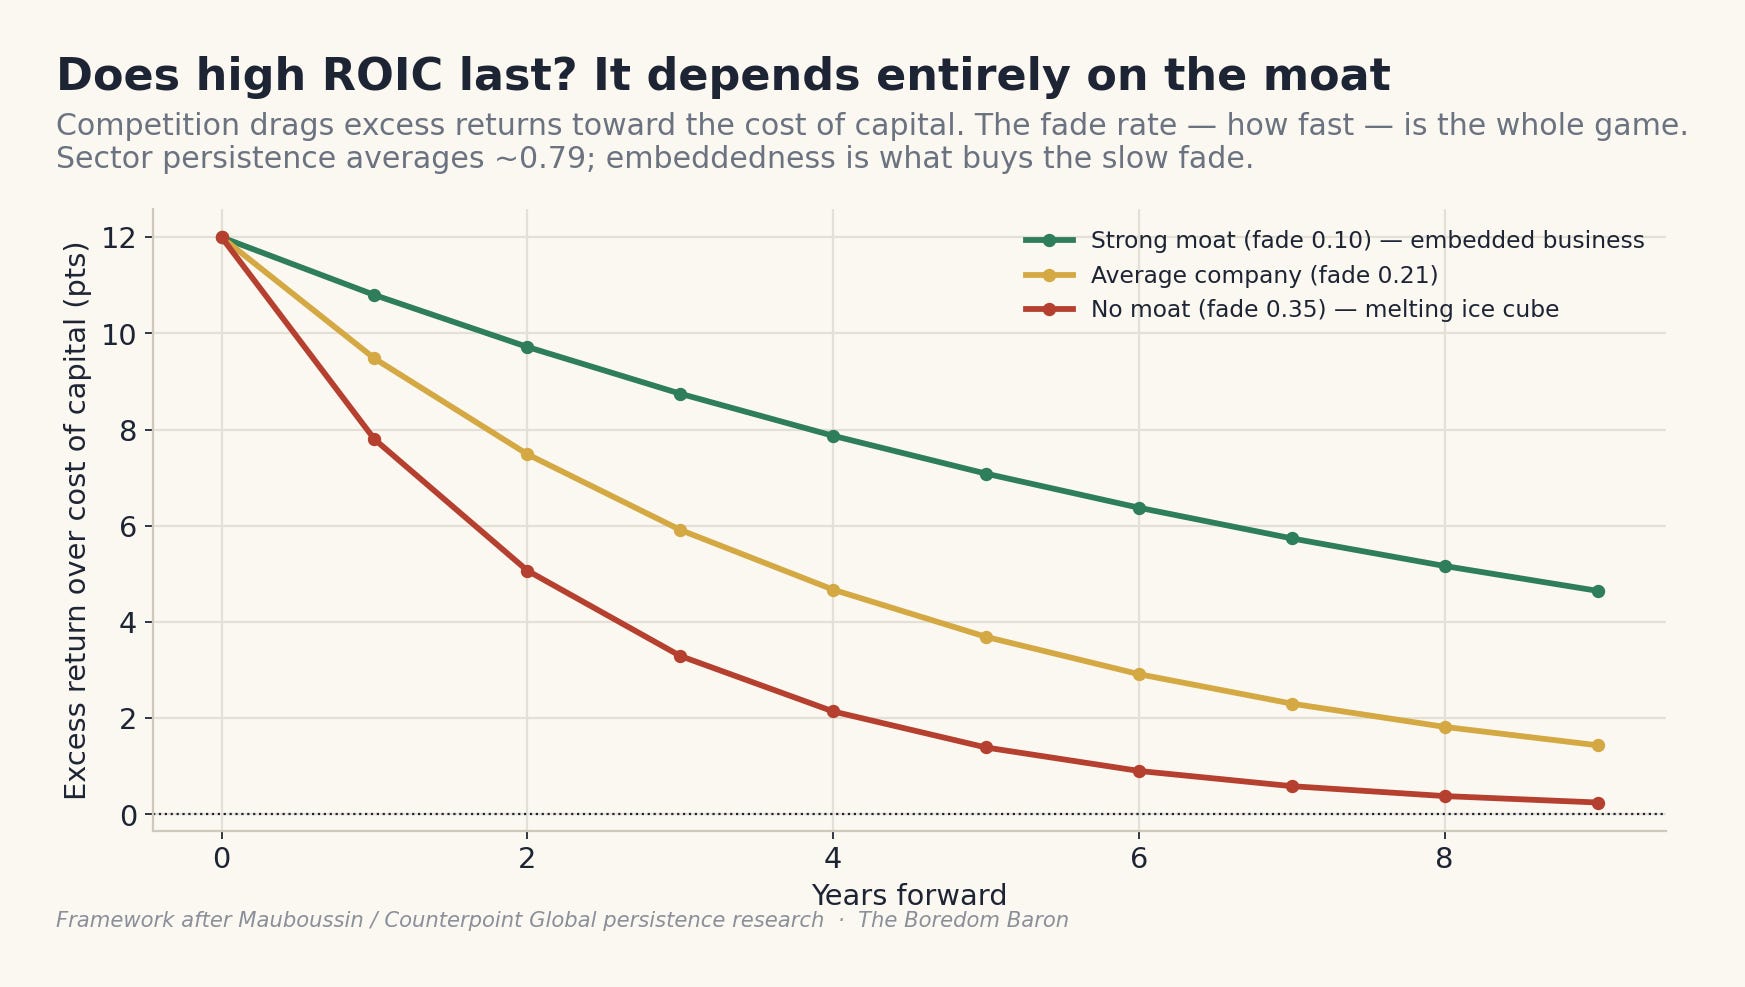
Deep Dive: Does High ROIC Last? Persistence, Fade, And Why Small-Caps Need A Moat
Here is the objection a thoughtful reader should now raise, and it is the right one. If high returns on capital are so wonderful, why does everyone not pile in until they are competed away? The answer is that they usually are competed away, and understanding the exceptions is the whole job. The essential research here is Michael Mauboussin's work, both his 2007 study on reversion to the mean and the more recent Counterpoint Global analysis, and it tells a nuanced story. The baseline is grim for optimists: ROIC reverts toward the cost of capital over time, in every period anyone has studied, because high returns attract competition and capital until the excess is bled away, exactly as microeconomic theory predicts. This is the gravity that pulls every great business back toward mediocrity.
But gravity can be resisted, and the data on how much is illuminating. Counterpoint Global’s recent work measures the fade rate, the speed at which a company’s excess return over its cost of capital decays, and finds sector persistence factors averaging around 0.79, which implies that roughly 79 percent of a company’s excess return persists from one year into the next, with fade rates ranging across sectors from about 0.10 to 0.30 and averaging around 0.21. In their older quintile analysis, something like 41 percent of the companies that started in the highest ROIC quintile were still in the top quintile nine years later, and the great majority never fell to the bottom tiers, though only a tiny fraction stayed top-ranked every single year, because there is a great deal of churn in between.
Two findings matter most for what I do.
Mauboussin shows that one-year persistence figures overstate the fade, and that five-year correlations, which filter out the noise, reveal that genuine structural advantages persist considerably longer than most analyst models assume, meaning the market is systematically too pessimistic about how long a real moat lasts.
This is the uncomfortable one for a small-cap specialist like me, large companies have shown consistently higher ROIC persistence than small ones since the mid-1980s. Small companies, on average, fade faster.
I want to be honest about that last point rather than hide it, because it sharpens my whole thesis rather than undermining it. If the average small-cap fades faster, then identifying the small-cap exceptions, the ones whose high returns will persist, is where the entire edge lives, and it cannot be done with a screen that simply ranks today’s ROIC. It requires understanding why the returns are high and whether the source of that advantage will endure. A high ROIC with no identifiable moat is a melting ice cube, soon to revert. A high ROIC protected by something structural is a compounder. The job is to tell them apart, and that is precisely what my embeddedness framework exists to do. Embeddedness is, in the language of this deep dive, simply a low fade rate with a mechanism: a business wired so deeply into its customer’s operations that competition cannot pry the returns loose, so the excess return that the average small-cap surrenders in three or four years persists in this one for ten or fifteen. The fade rate is the number; embeddedness is the reason.
The Sophisticated Case: When Reported ROIC Lies (And What To Do About It)
Before I connect the threads, one more real example, because I promised to show you the goodwill problem in the flesh and because it ties this piece directly to my last one on owner earnings. Equasens (Euronext Paris: EQS), the dominant software provider to French pharmacies and one of the most deeply embedded businesses I cover, presents a puzzle on a first glance at the screens. Rebuild the ratio from its EODHD-reported FY2024 accounts and the headline return on invested capital, with the goodwill left in, comes out at only about 14 to 15 percent, alongside a return on equity around 16 percent. Fourteen-odd percent is respectable but it is not the stratospheric figure you would expect from a sticky, mission-critical software business with a near-impregnable competitive position, the kind of business that should gush returns. So what is going on? Is Equasens secretly mediocre?
No, and the reason is the goodwill trap from the calculation deep dive, now made concrete. Equasens has spent years acquiring adjacent software niches, and every one of those deals loaded its balance sheet with goodwill and acquired intangibles, inflating the invested capital denominator, while the amortization of those acquired intangibles (which rose to about EUR 15.5 million in 2024) depresses the reported operating profit in the numerator. Both effects push the reported ROIC down. Look at the goodwill alone: it grew from about EUR 49.8 million in 2019 to EUR 104 million in 2024, more than doubling. That swelling denominator is most of the story behind the unremarkable headline return.
Worked Example Two: How To Compute ROIC Three Ways On Equasens
So let me do the work the screens never do, building the number up from the FY2024 accounts so you can see exactly where each version comes from. Start with the numerator. Equasens earned operating profit of about EUR 48.2 million on a tax rate near 20 percent, and after a couple of judgment calls on the acquired-intangible amortization you arrive at NOPAT of roughly EUR 38.5 million. That is the after-tax operating cash the business throws off. Now the only thing that changes across the three versions is the denominator, the invested capital, and watch what each choice is actually asking.
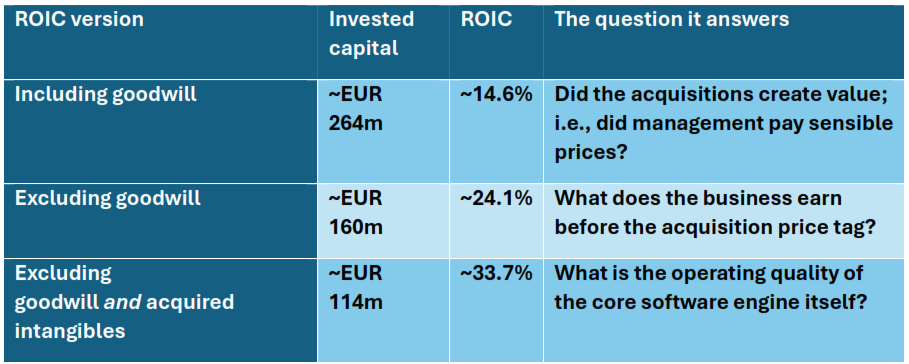
Three numbers, all true, all derived from the same NOPAT, every one answering a different question. The roughly 14.6 percent including goodwill is the verdict on capital allocation: across all its deals, Equasens deployed capital at a decent but not extraordinary rate, which is to say it paid sensible prices. Fine. But that figure tells you almost nothing about the operating quality of the underlying software business. Strip the acquisition goodwill out of invested capital and the return climbs to about 24.1 percent. Strip out the acquired intangibles as well, leaving only the capital the core operations genuinely need, and it reaches roughly 33.7 percent — the genuinely high, embedded-franchise return you expected all along. The core software operations require very little tangible capital, because the real investment is the code and the people, already expensed through the income statement.
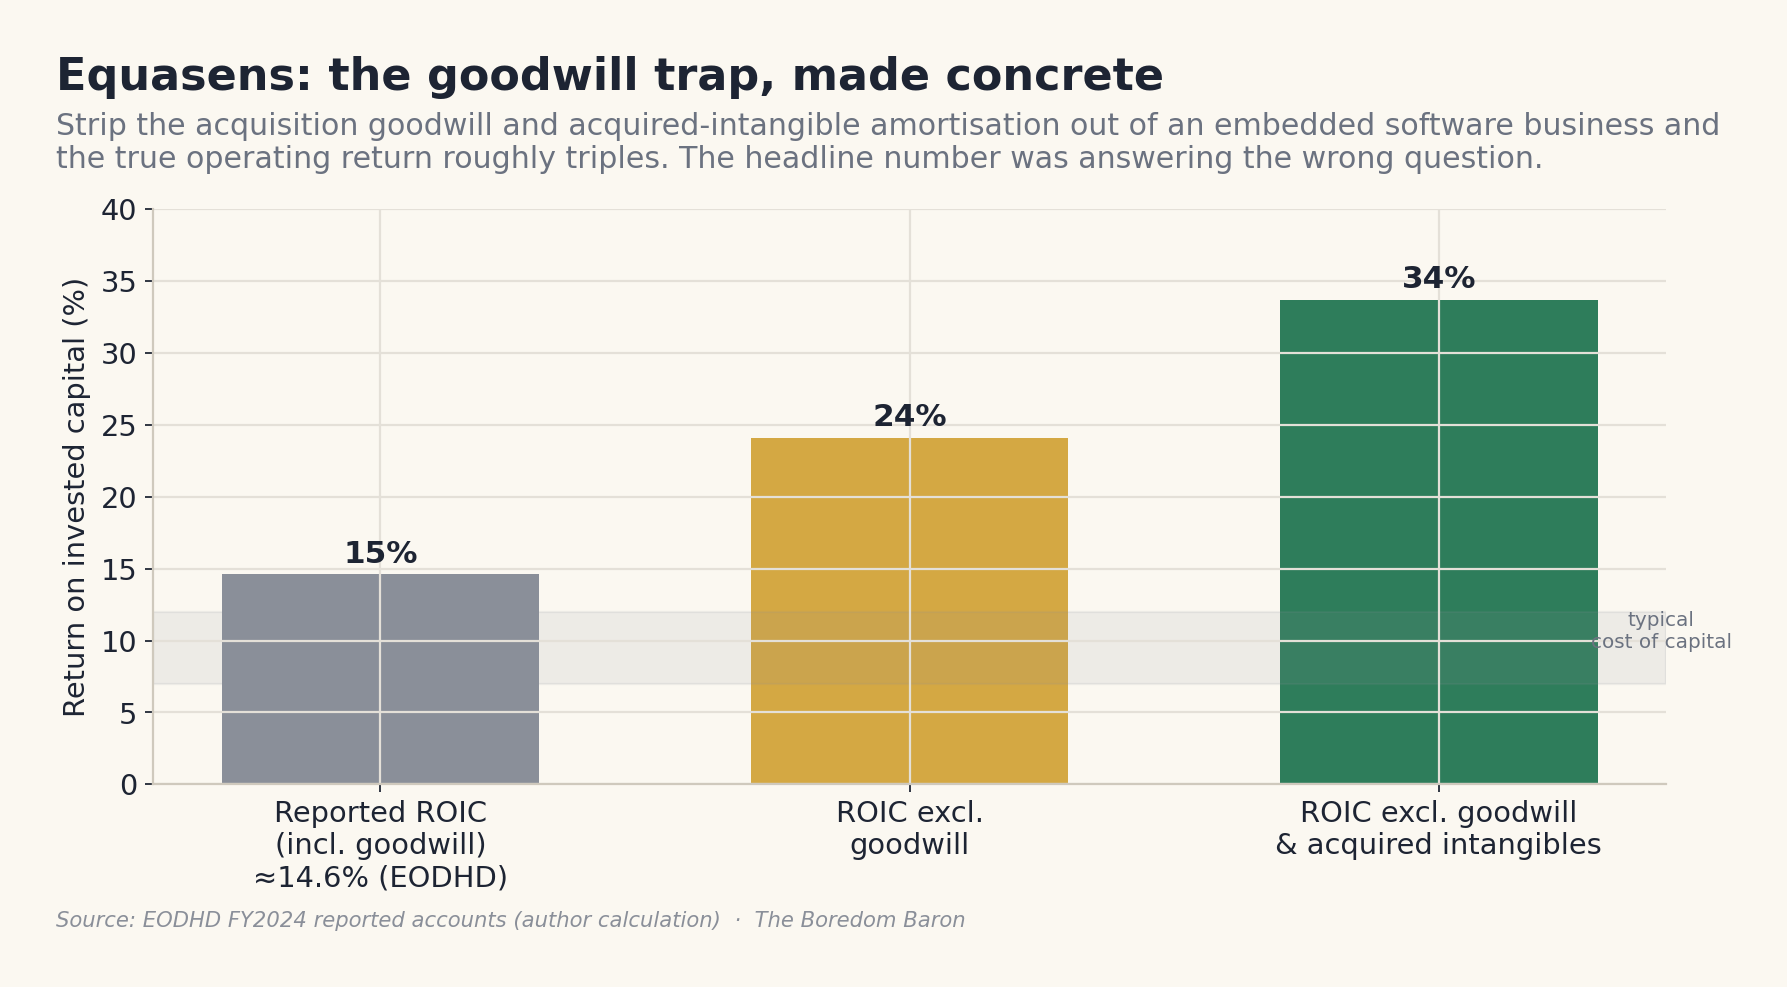
The headline figure in the mid-teens and the true operating return near thirty-four percent are two different facts answering two different questions, and an investor who reads only the headline number concludes Equasens is ordinary when the embedded engine underneath is anything but. This is the Confession Lag from my earlier work wearing a different costume, the gap between the messy reported number and the real economic truth that the market is slow to price. The headline measure shows about 15 percent; the business earns something closer to 34 percent on the capital that actually matters; and the gap between those two numbers, on a name followed by a handful of analysts, is exactly the kind of mispricing the attention desert serves up to anyone willing to rebuild the ratio from scratch.
Deep Dive: The Other Places ROIC Will Mislead You
A few further warnings, briefly, so you do not become a ROIC zealot. Cyclicals lie at the peak and the trough: a steel maker, a semiconductor equipment firm, or a hazardous-waste recycler like Befesa will post a gorgeous ROIC at the top of its cycle and a wretched one at the bottom, and neither is the true through-cycle figure, which is why a cyclical must be normalized across the cycle before its returns mean anything. This is the same normalization discipline I apply to owner earnings, and it is no accident that the two ideas travel together: a number measured at a single point in a cycle is a snapshot of weather, not climate. Old, fully-depreciated assets inflate ROIC by shrinking the denominator, flattering tired incumbents that have not had to replace their plant yet. Banks and insurers do not fit the framework cleanly at all, because for a financial institution capital is the raw material rather than a means to an end, so ROIC as defined here is close to meaningless for them and you need return on equity or return on tangible equity instead. And the most sobering caveat of all, raised by thoughtful skeptics of the quality-investing creed, is that sustaining an eighteen percent return on capital for two or three decades, the Munger ideal, is genuinely rare, far rarer than the screens full of currently-high-ROIC names would suggest. Most high returns fade. Paying an expensive looking price is only justified when the persistence is real, and persistence is a judgment about the moat, not a line you can extrapolate from a spreadsheet. Treat a high ROIC as the beginning of an investigation into durability, never as the conclusion.
Why Does ROIC Analysis Pay Off More In The Attention Desert?
Now let me bring this home to where I actually hunt, because ROIC analysis pays more in some places than others. In a heavily-covered market, when a company’s returns on capital are high and durable, an army of analysts has already noticed, written it up, and bid the multiple to reflect it, so the quality is in the price. The mispricing is small. In the European small-cap attention desert, where the average non-US small-cap is followed by roughly 3.3 analysts and many by none at all, two distinct things go unpriced. The market misprices the level of returns, failing to compute a proper ROIC at all on a messy, acquisitive, goodwill-laden small-cap like Equasens and concluding it is ordinary. And the market misprices the persistence of returns, lazily extrapolating the average small-cap fade onto a specific embedded business whose advantage will actually endure, or failing to recognize the moat entirely. Both errors are gifts to the patient investor who does the work, and both persist far longer than they would in a crowded market, because there is no army of analysts to arbitrage them away. The very fact that small-caps fade faster on average is what makes the under-covered exceptions so mispriced, because the market tars them all with the same brush.
There is a quiet asymmetry here that I find endlessly comforting. The work required to rebuild a clean ROIC on a goodwill-laden French software company is exactly the kind of tedious, unglamorous, weekend-killing exercise that the marginal price-setter in an under-covered stock has no incentive to perform. A sell-side analyst covering forty names cannot afford to spend a day reconstructing one company’s invested capital three different ways. I can, because I cover almost nothing, and because the boredom is the moat. The attention desert is not a hardship to be endured on the way to an edge; the desert is the edge.
Where Does ROIC Meet Embeddedness And Owner Earnings?
This is where my obsessions click into a single method, and the trilogy completes itself. Supply chain embeddedness is the framework that explains why a high ROIC will persist, because it identifies businesses wired so deeply into their customers’ operations that competition cannot easily bleed away their returns. The mechanism is exactly the fade rate from the persistence research: a deeply embedded business, one whose product is mission-critical and painful to switch away from, has a long competitive advantage period, which is to say a low fade rate, which is to say its excess returns over the cost of capital persist for years rather than evaporating. Embeddedness is, in this precise sense, the structural reason a small-cap can defy the small-cap gravity that pulls returns back to the mean.
Owner earnings, the subject of my last piece, is the honest numerator: the reason reported ROIC misleads on a name like Equasens is that reported profit is distorted by acquisition accounting, and the owner earnings adjustments are how you recover the true return. The same instinct that adds back acquired-intangible amortization to find owner earnings is the instinct that strips goodwill out of invested capital to find the real ROIC; they are two halves of the same act of seeing through the accounting to the cash. And ROIC is what tells you whether a business deserves the premium multiple that the bear-base-bull scenario work will then apply, because there is no point modeling a generous bull case for a business whose returns are about to fade to the cost of capital. The three ideas are one process. Embeddedness tells you the high returns will last, owner earnings tells you what the returns truly are, and ROIC versus the cost of capital tells you whether the business is compounding your wealth or quietly consuming it. A genuinely embedded business with a high, persistent, properly-measured ROIC, trading in a market too sleepy to have noticed, is the whole thesis in a single sentence, and it is the rarest and most rewarding thing I ever find.
Frequently Asked Questions
What is return on invested capital (ROIC)? ROIC is net operating profit after tax (NOPAT) divided by invested capital. NOPAT is EBIT times one minus the tax rate; invested capital is debt plus equity minus surplus cash, or net working capital plus net fixed assets plus needed intangibles. It measures how many cents of after-tax profit a business earns per unit of operating capital, independent of how it is financed.
How do you calculate ROIC step by step? First compute NOPAT: take operating profit (EBIT) and multiply by one minus the tax rate. Then compute invested capital: add debt and equity and subtract surplus cash, or add net working capital, net property and equipment, and the intangibles the business genuinely needs. Divide NOPAT by invested capital and express it as a percentage. The judgement is in three adjustments: surplus cash, goodwill, and old fully-depreciated assets.
What is the difference between ROIC and WACC? ROIC is the return a business earns on its operating capital; WACC, the weighted average cost of capital, is what that capital costs, typically 7-12%. The spread between them is what matters. When ROIC exceeds WACC, every euro deployed creates value, so growth helps. When ROIC is below WACC, growth destroys value. The spread, not the level of ROIC, is the whole game.
What is the difference between a compounder and a value trap? A compounder earns a high ROIC and can reinvest fresh capital at that same high rate, so its intrinsic value snowballs even from an expensive-looking price. A value trap earns a low ROIC, often below its cost of capital, and looks statistically cheap precisely because the market correctly senses its growth is value-destroying. The low multiple is a warning label, not a discount tag.
Why can a stock at two times earnings be a worse buy than one at thirty times? Because the multiple says nothing about whether the business creates or destroys value as it grows. A two-times-earnings business earning below its cost of capital burns shareholder wealth every year it expands, so the low multiple is deserved. A thirty-times business reinvesting at 30% on capital compounds wealth so fast the entry multiple barely matters over a decade, Munger’s point exactly.
Does a high ROIC last, or does it fade? It usually fades. Competition drives returns toward the cost of capital over time. Mauboussin and Counterpoint Global find roughly 79% of a company’s excess return persists year to year on average, with fade rates of 0.10-0.30. About 41% of top-ROIC-quintile firms remain top-quintile after nine years, but very few stay top every year. A durable moat is what buys the slow fade.
Why does reported ROIC understate the quality of serial acquirers like Equasens? Acquisitions load the balance sheet with goodwill and acquired intangibles, inflating the invested-capital denominator, while amortization of those intangibles depresses reported operating profit in the numerator. Both push ROIC down. Strip goodwill out and you measure operating quality; keep it in and you measure whether management paid sensible prices. For Equasens the two answers are ~14.6% and ~33.7%; both true, answering different questions.
When does ROIC mislead, and where does the framework break down? ROIC flatters cyclicals at the peak and depresses them at the trough, so normalize across the cycle. Old fully-depreciated assets shrink the denominator and inflate the ratio. Banks and insurers do not fit — use return on equity or return on tangible equity instead. And sustaining 18% for two or three decades is genuinely rare, so treat a high ROIC as the start of an investigation into durability, never the conclusion.
Why does ROIC analysis pay off more in European small-caps? In heavily-covered markets, durable high returns are already noticed and priced. In the European small-cap attention desert (where the average non-US small-cap is followed by about 3.3 analysts) the market misprices both the level of returns (it never computes a clean ROIC on a goodwill-laden name) and their persistence (it lazily extrapolates the average small-cap fade onto a genuinely durable exception). Both errors are gifts to the patient.
Is a high dividend yield a good signal of value? Not on its own. A fat yield on a business earning below its cost of capital is often the market pricing a deserved disappointment, and the dividend frequently gets cut. Vodafone offered a yield north of 11% before halving its dividend in 2024 from 9 cents to 4.5. Ask whether high returns come with a reinvestment runway or just a fat payout that the low ROIC cannot sustain.
My Value Ramblings
So where does this leave us, fellow students? With a number, a relationship, and a warning. The number is return on invested capital, after-tax operating profit over the capital tied up in the business, and my screen starts it at a sustained fifteen percent because that sits well clear of the seven to twelve percent most businesses pay for capital, and that clearance is where compounding is born. The relationship, the one that matters more than the level, is the spread between that return and the cost of capital, because it determines whether the most celebrated thing in business, growth, is building your wealth or burning it. And the warning is that the cheap stock is often cheap for a reason your screen cannot see, that a two-times multiple on a business earning below its cost of capital is not a bargain but a correctly-priced disappointment, while a forty-times multiple on a business compounding capital in the high twenties can be the buy of the decade, exactly as Munger promised.
The discipline, one last time so it lodges: compute ROIC honestly, with the goodwill and cash and old-asset adjustments that the screens skip, compare it to the cost of capital rather than admiring it in isolation, ask whether high returns come with a reinvestment runway or just a fat dividend, and then, most importantly, ask the only question that really matters, which is whether the returns will last. That last question is not answered by ROIC at all. It is answered by the moat, by the embeddedness, by understanding why the business earns what it earns and whether anything can take it away. ROIC tells you the returns are high today. Only judgment tells you they will be high tomorrow. A screen is a starting point, never an ending point. Buffett would tell you that investors as a whole can extract from their businesses only what those businesses actually earn, and ROIC is simply the most honest measure we have of what a business earns on the capital you have entrusted to it. Find the ones that earn a lot, durably, in a market too bored to notice, and let the compounding do the rest. That, the way I see it, ticks every box that matters.
The Trilogy
This is the second of three companion pieces on the method. There are another two coming.
Every figure in this piece is real and sourced to the public record (the Kardex, Vodafone, Equasens and other ROIC and market figures computed directly from EODHD fundamentals and end-of-day data pulled June 2026, the Vodafone qualitative facts to the company’s own FY2023 and FY2024 results and Morningstar, the Munger passage to his 1994 talk on worldly wisdom, and the persistence data to Mauboussin’s 2007 study and Counterpoint Global’s recent work), but they are my starting point and not my ending point, so run them through your own spreadsheet and tighten them before you trust them with a euro. That, after all, is the whole spirit of the thing.
Sincerely,
The Boredom Baron
This Substack is reader-supported. To receive new posts and support my work, consider becoming a free or paid subscriber.
Disclaimer:
The content of this article reflects my personal views and is provided for informational and educational purposes only. It does not constitute investment advice, financial advice, or a recommendation to buy or sell any securities or financial instruments.
While I strive for accuracy, the information presented may contain errors or omissions, or be based on sources believed to be reliable but not independently verified. I make no representations or warranties as to the completeness, accuracy, or timeliness of any information presented.
This article is not intended to provide, and should not be relied upon for, investment, legal, tax, or accounting advice. The securities and strategies discussed may not be suitable for all investors. Past performance is not indicative of future results. All investments involve risk, including the potential loss of principal.
I may hold, or have held, positions in the securities mentioned. I do not receive compensation for writing this article, nor do I intend to influence the price or trading volume of any security discussed. All opinions are subject to change without notice.
This content is written strictly in a personal capacity and does not reflect the views of any employer, organization, or associated entity. Readers are strongly encouraged to conduct their own independent research and to consult with a licensed financial advisor before making any investment decisions.
This Substack is reader-supported. To receive new posts and support my work, consider becoming a free or paid subscriber.